The post Feature spotlight: breakdown reports appeared first on Beyond.
]]>Get a high-level overview of a plan (or multiple plans) broken down by the details that are most important to you – profit and loss, company structure, or custom categories.
Then delve into the details where you need to, drilling down into departments, teams, and individual contributions to the plan to get a full picture of your budget – and any potential problems.
Plan breakdown reports
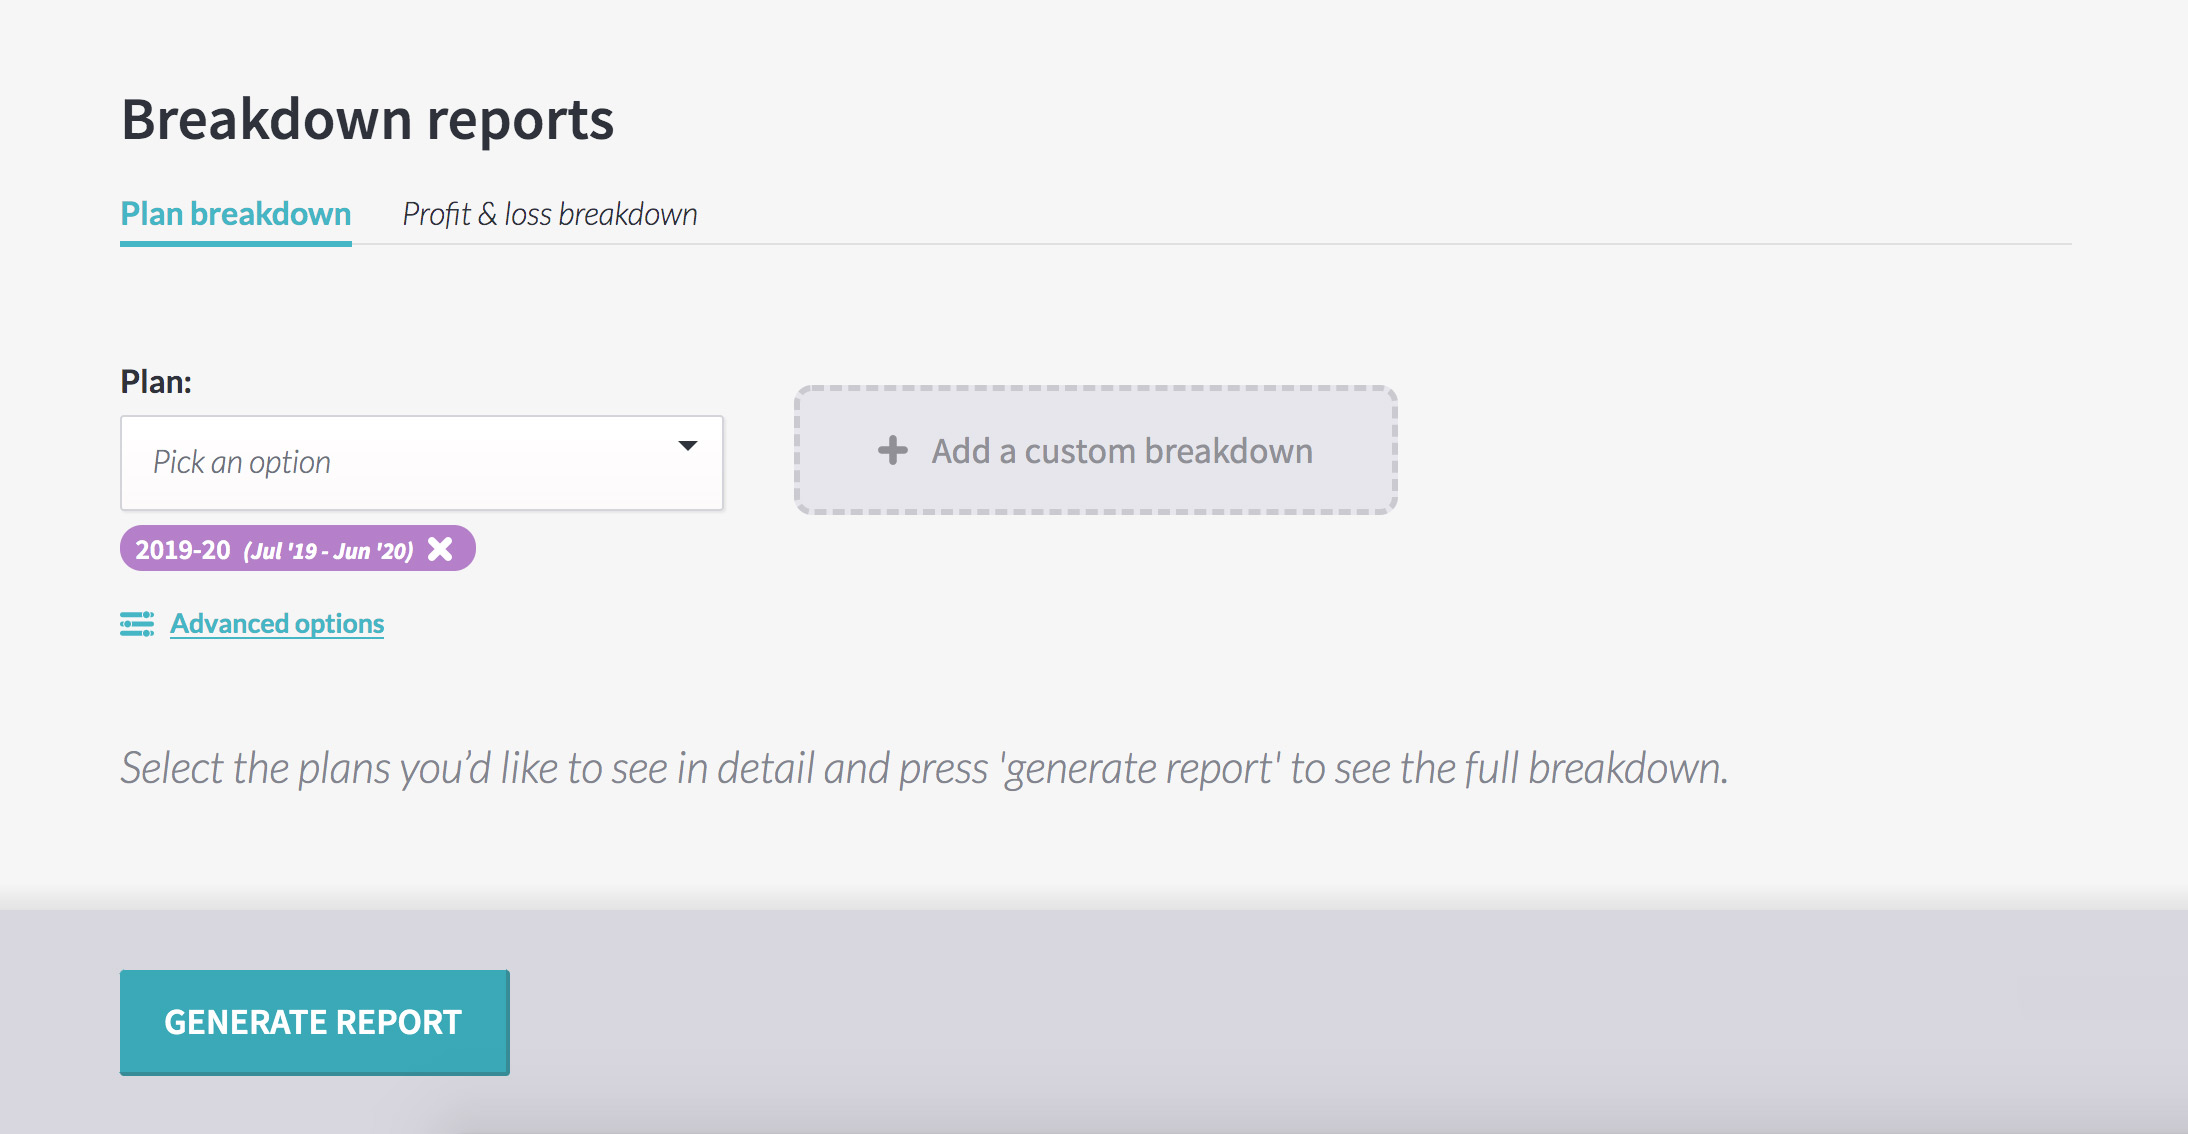
Available to managers and power users, the breakdown reports page is inside ‘management tools’.
To save you time, the plan your organisation is currently working on – like the 2020 budget – is pre-selected. Hit ‘generate report’ to see the plan, broken down by its first level of subsections.
Click the arrow by any subsection to drill down deeper, seeing that subsection’s subsections or its activities. Or, click the icon beside the section or activity name to jump directly to that part of the plan, to edit or manage it as needed.
When you’re finished, click the back button on your browser or ‘management tools’ in the navigation to return to the report.
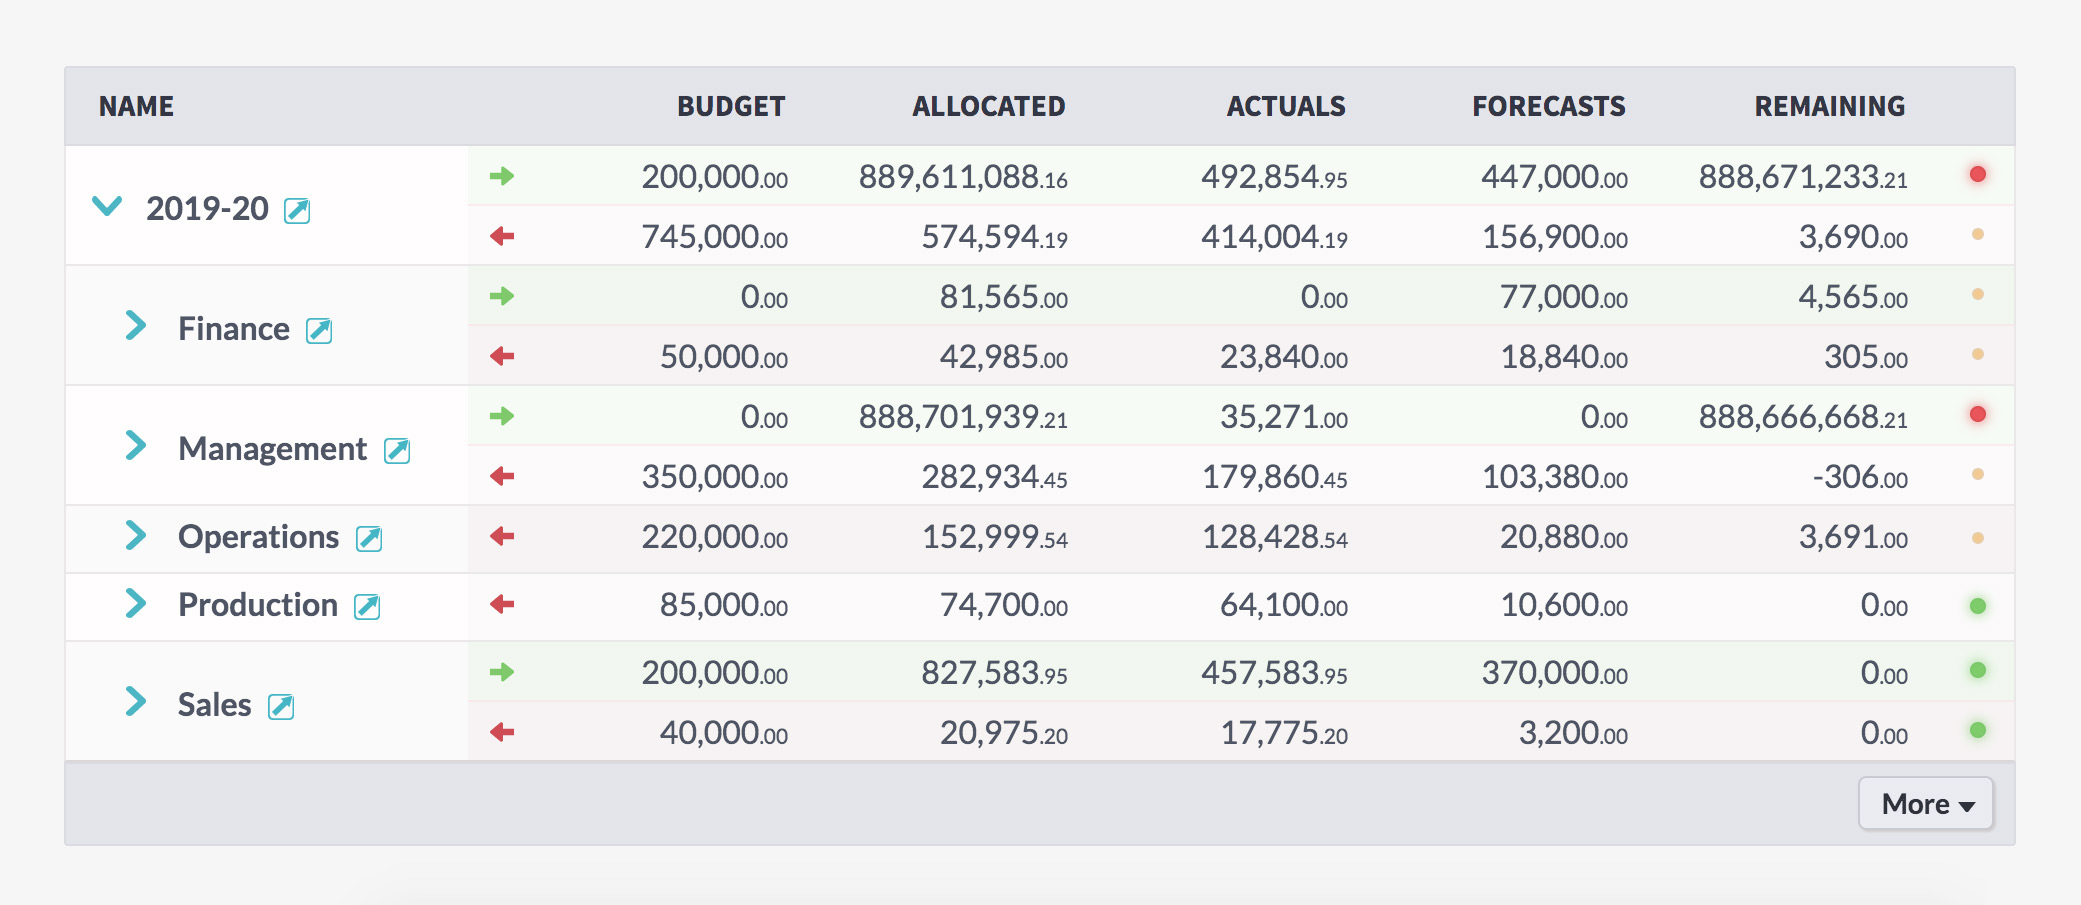
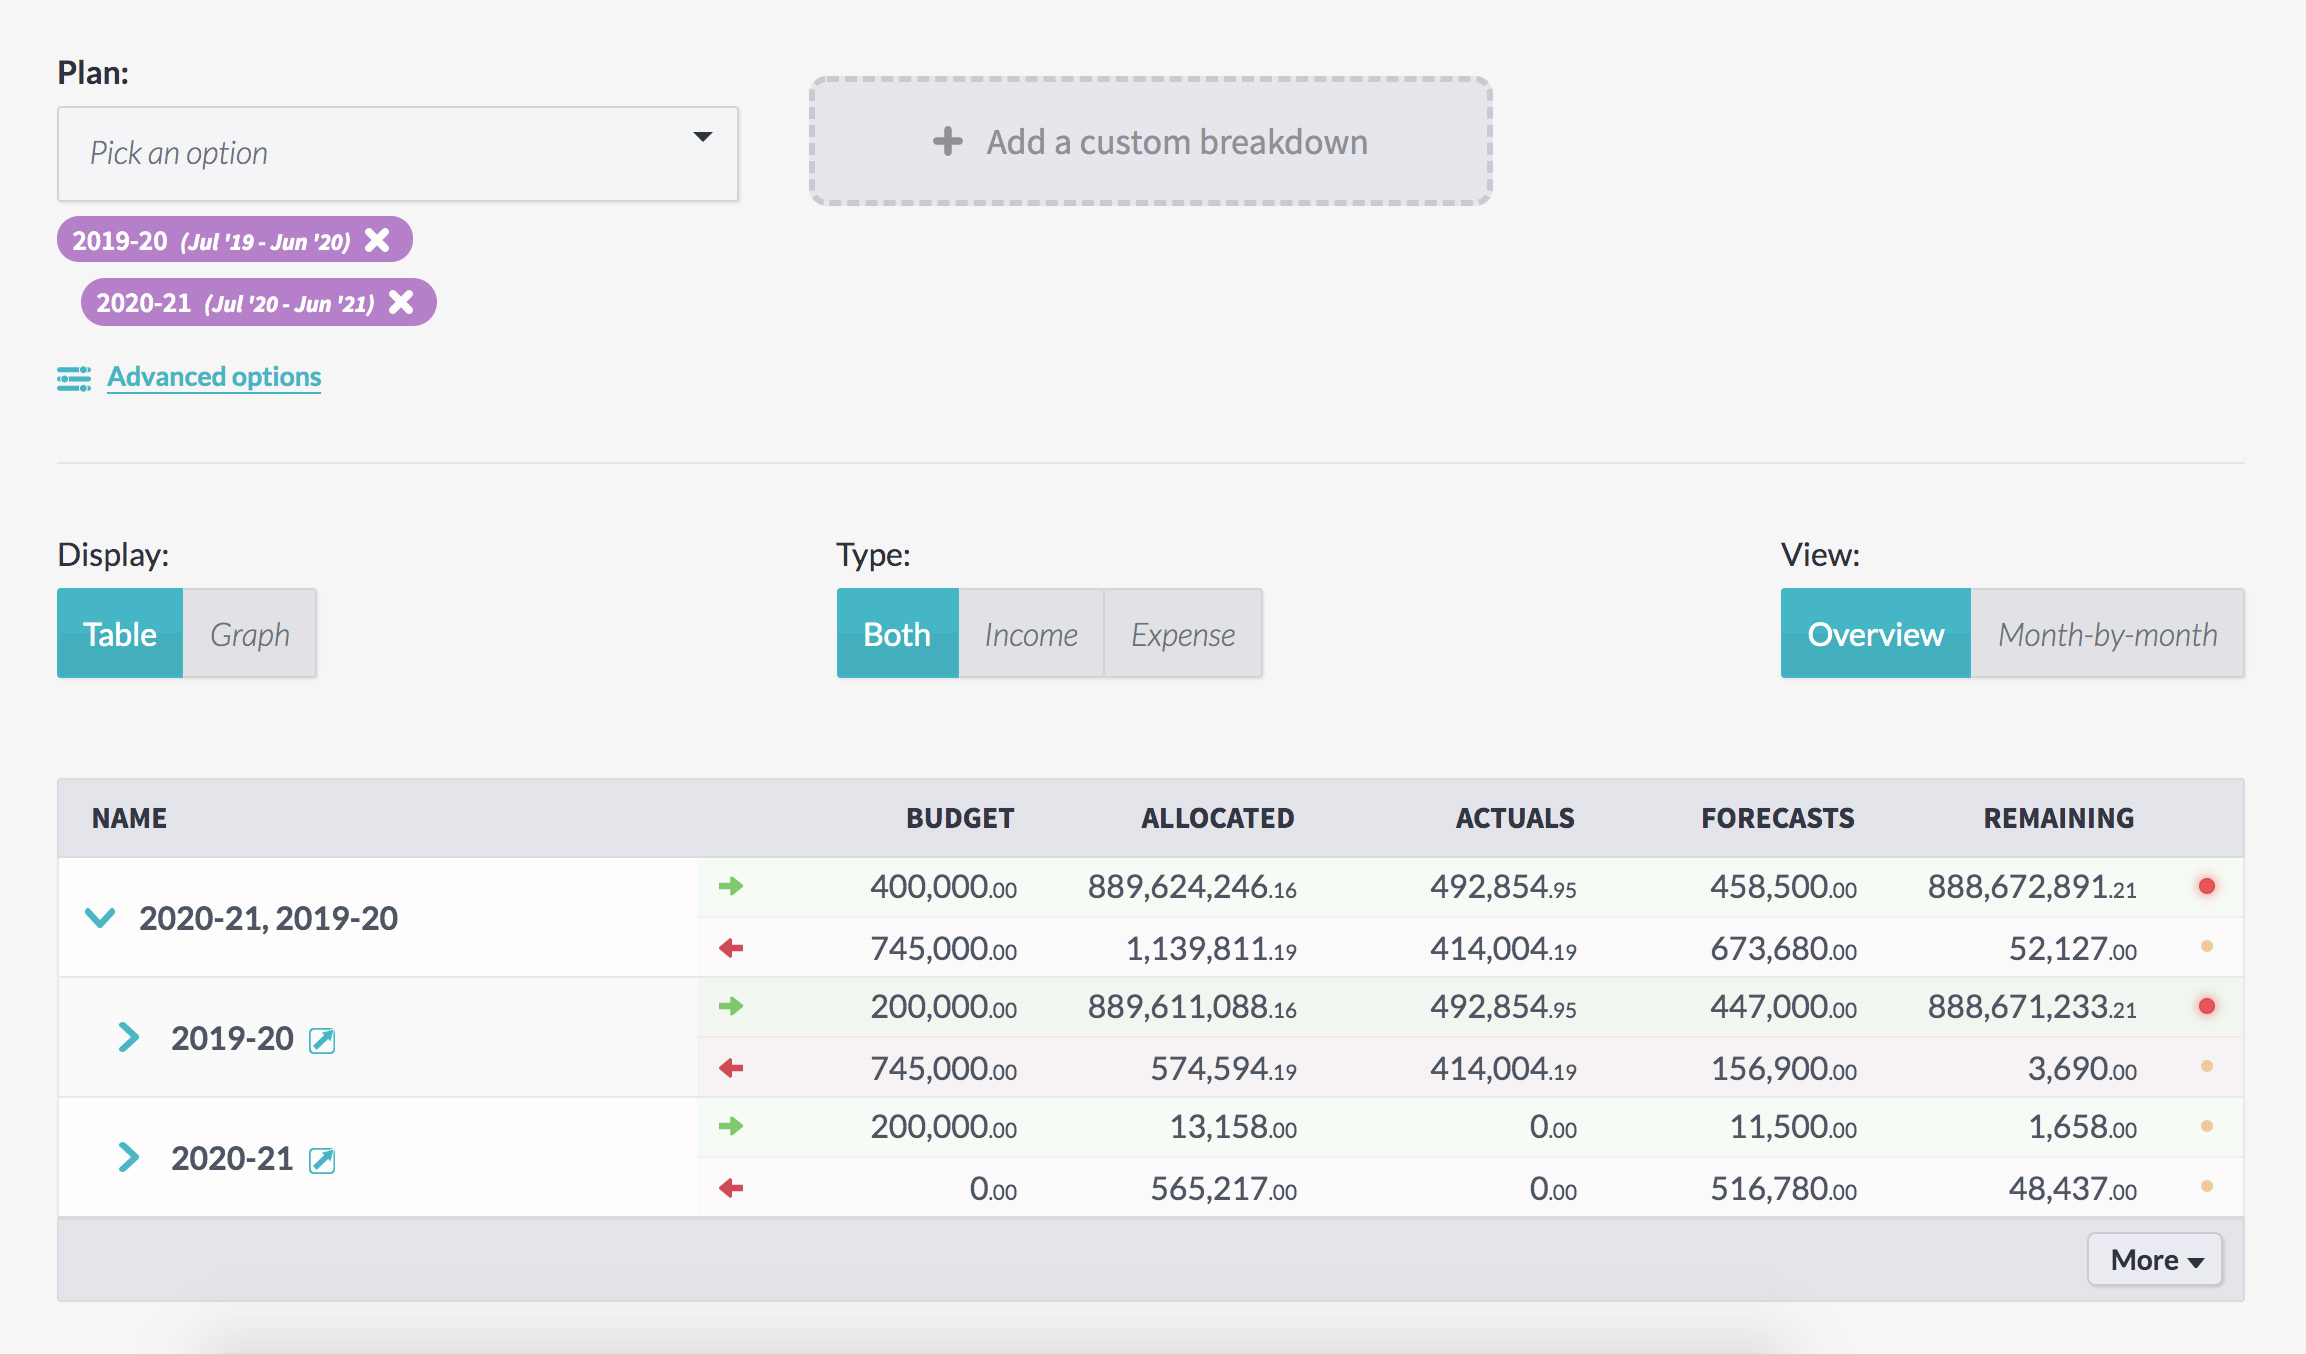
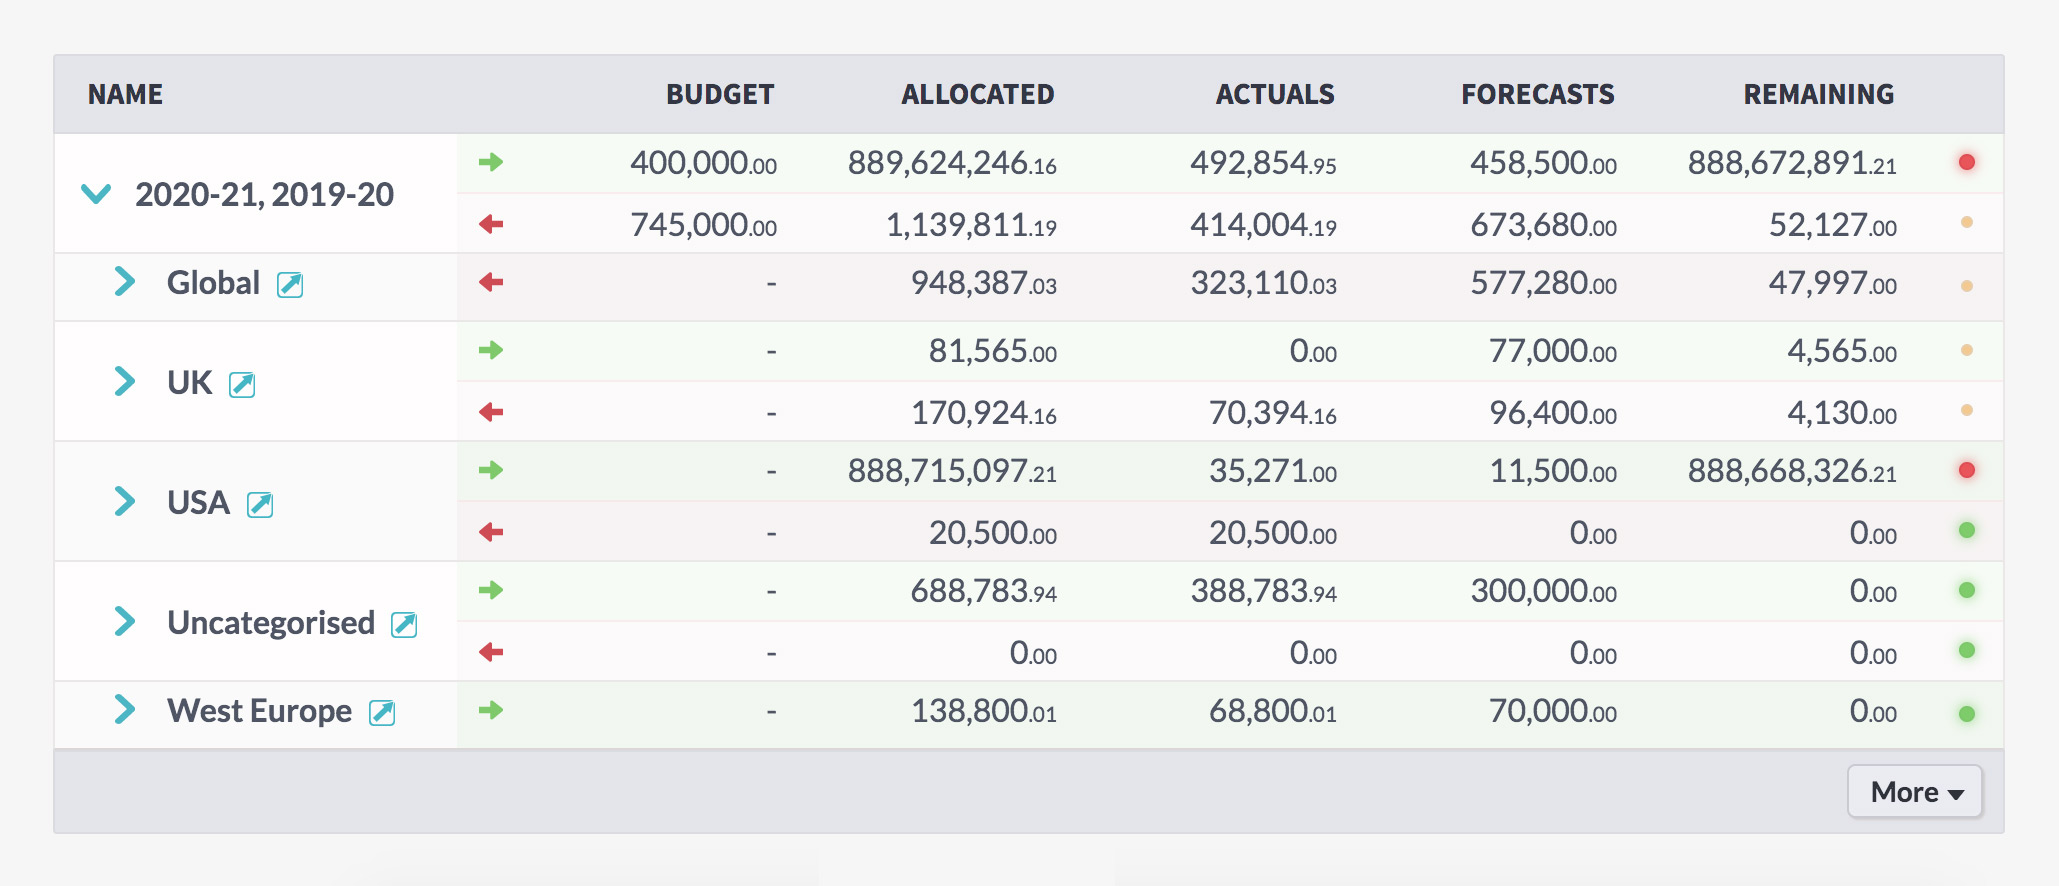
You can see the high-level details on the report itself – budget, allocated, actuals, forecasts, and remaining amount.
You can also see a status indicator for each section of the plan, showing if it’s over or under budget, so you can see which sections need attention.
View the report however it most makes sense to you
The report has toggles for ‘display’, ‘type’, and ‘view’ which you can change to see what’s most relevant for you.
Switch between a number-heavy table layout, to see the nitty-gritty details, or a graph if you prefer to see things more visually.
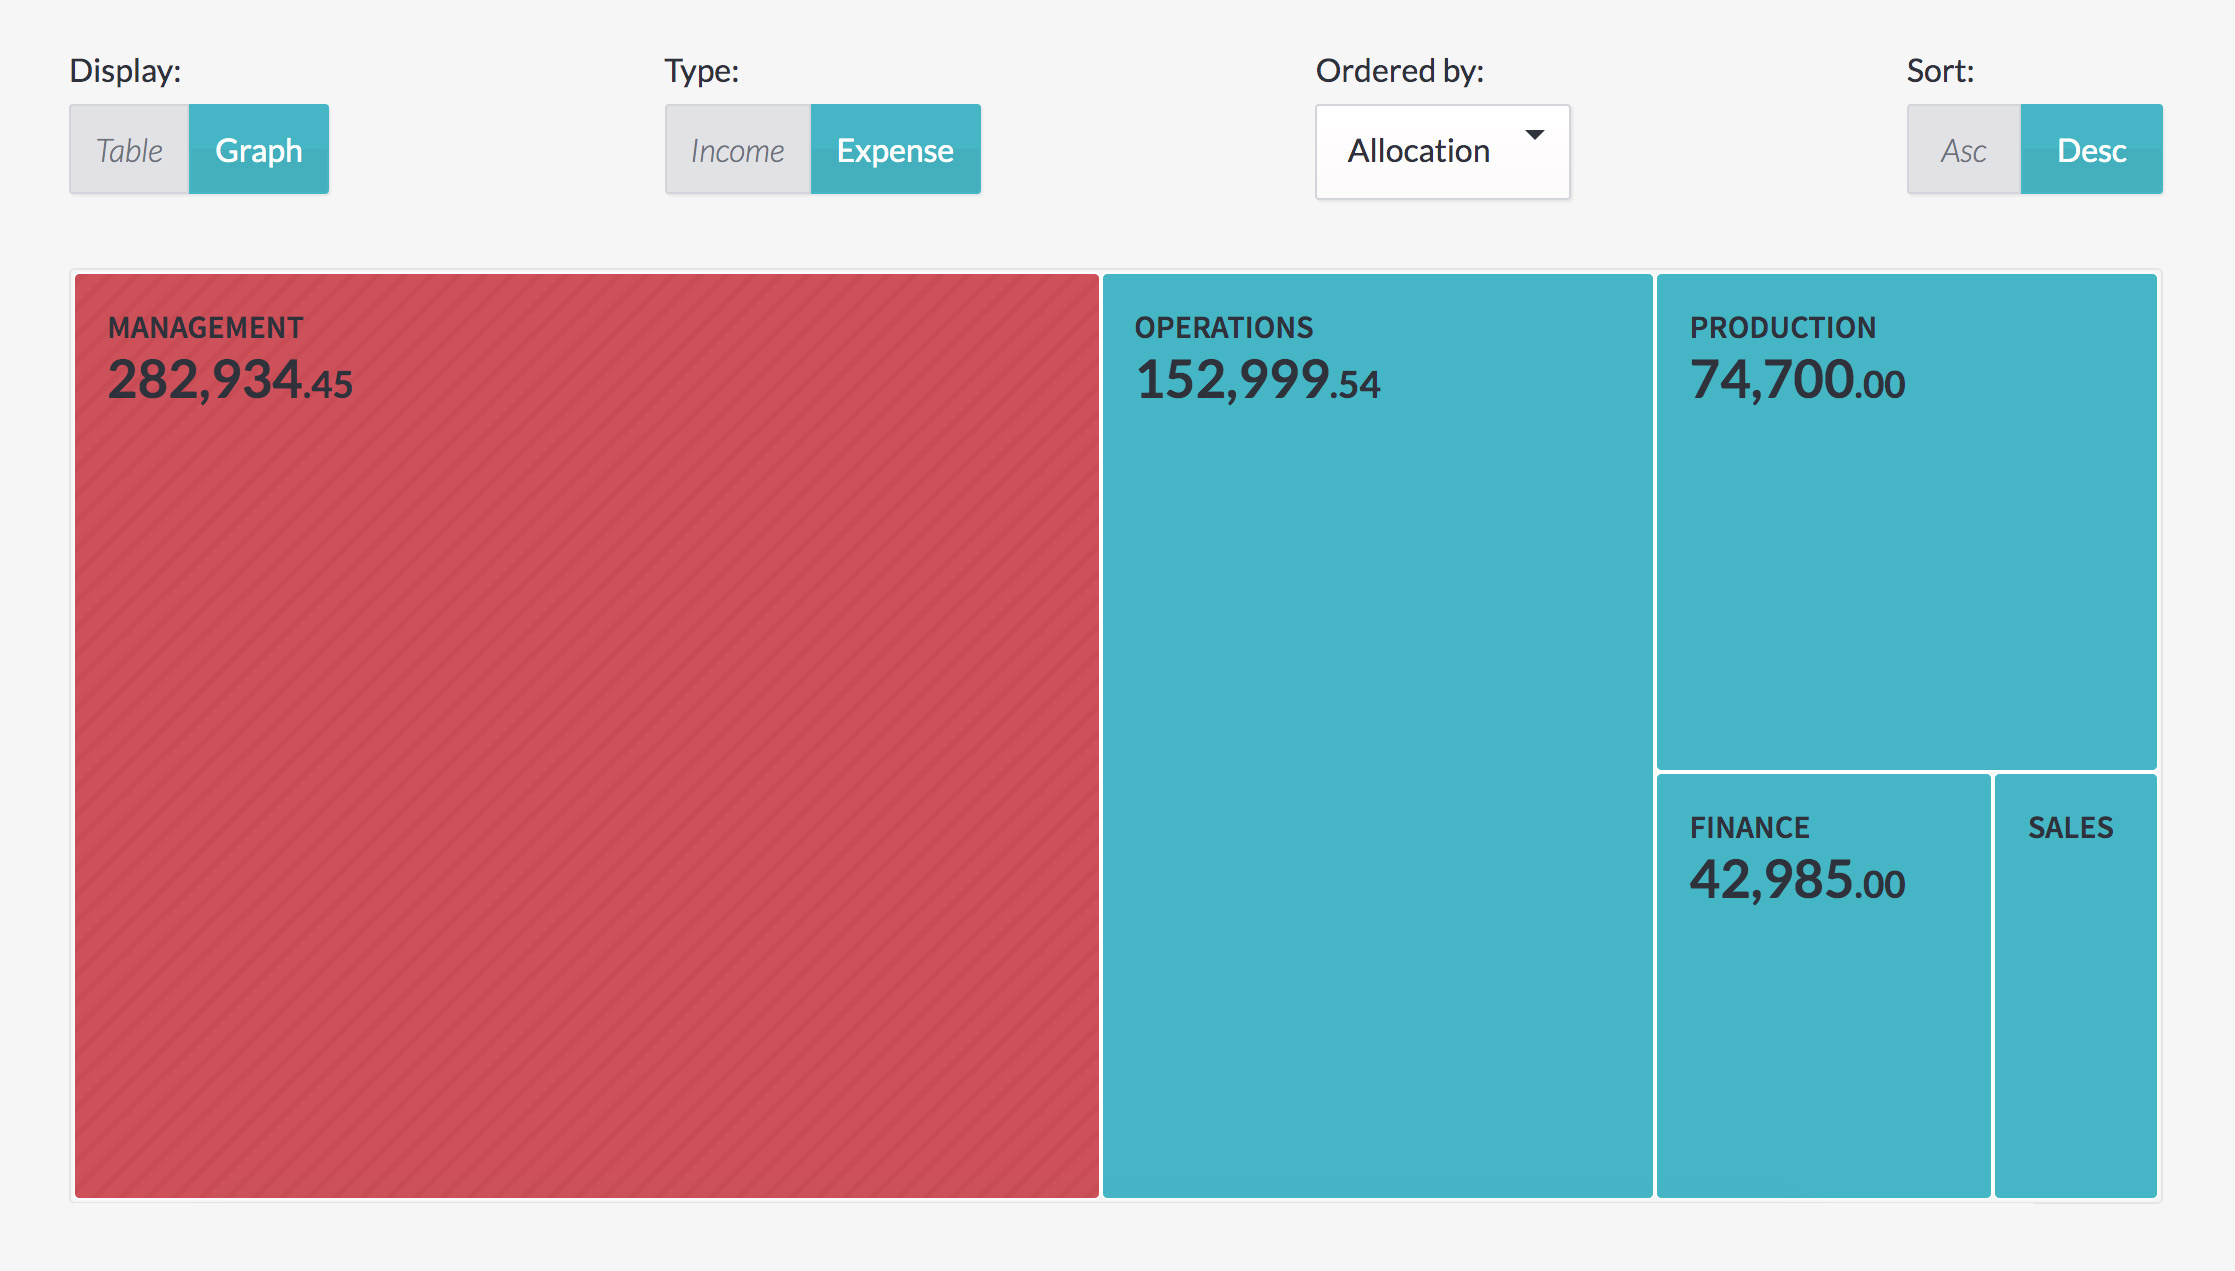
Focus on just the income or expense, under ‘type’, or click ‘both’ to see a full view of your business.
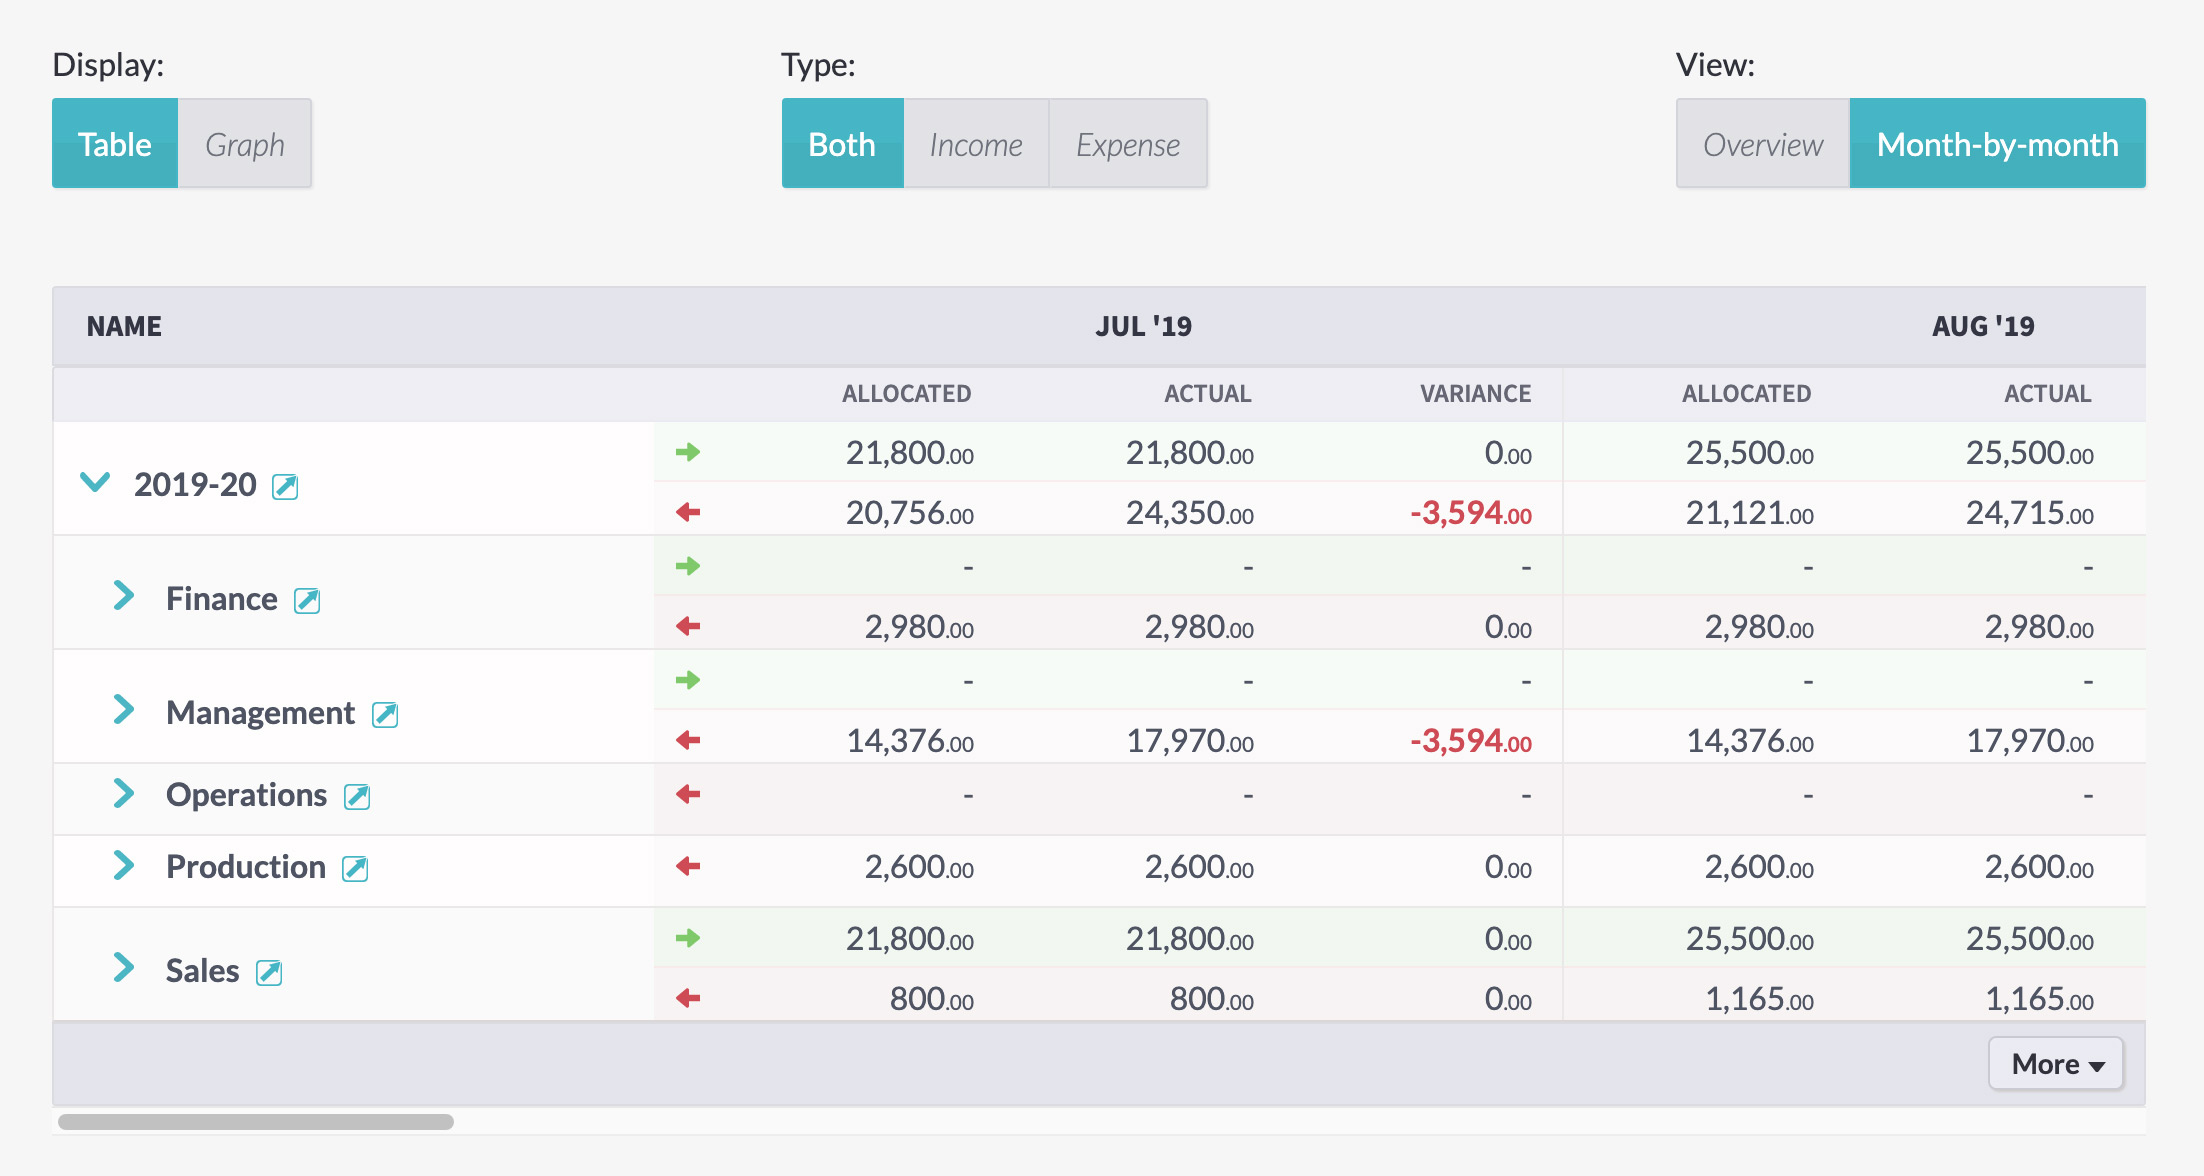
And click ‘month-by-month’ to see the figures broken into their allocated, actual, and variance figures for each month across the life of the plan, rather than the zoomed-out ‘overview’ of the budget.
And, of course, you can export your data to a .CSV file if you need to take it out of Beyond by clicking the ‘more’ button at the bottom of the report.
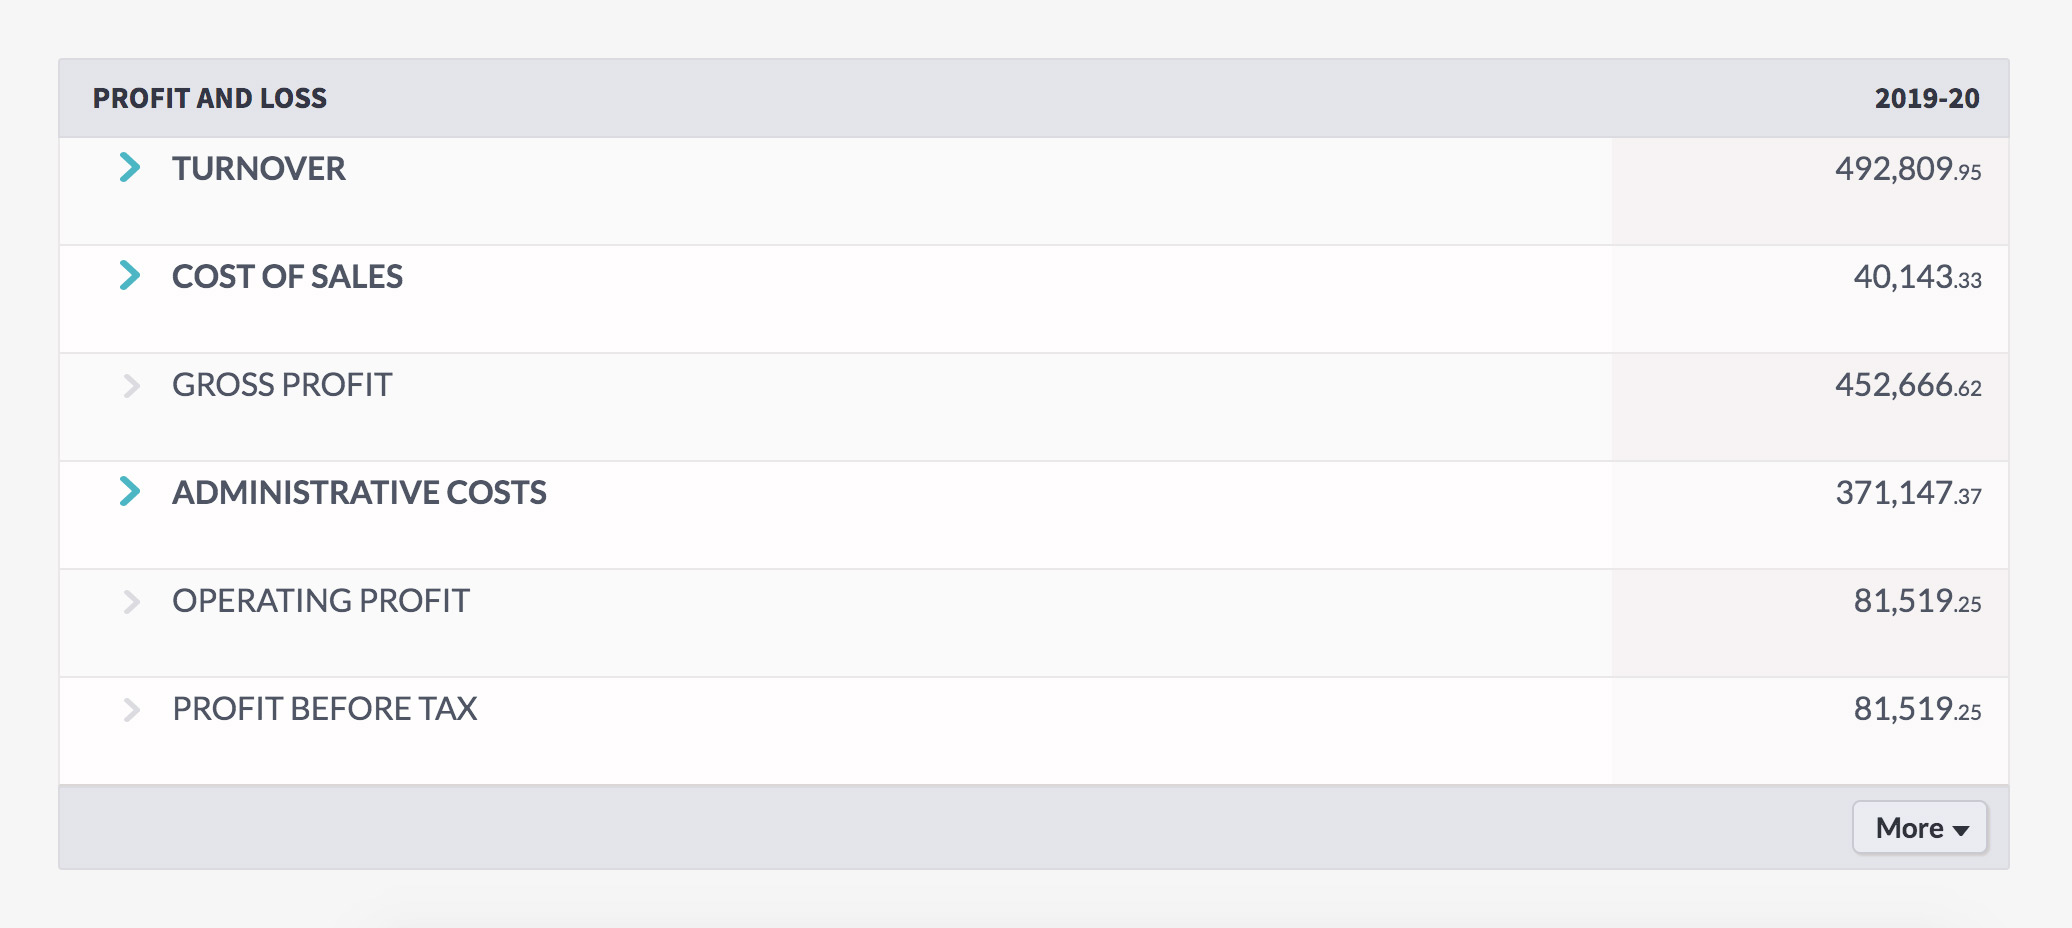
Profit and loss reports
And you can see more than the allocated and actual figures in your report – you can see a full profit and loss breakdown of your plan by clicking the ‘profit & loss breakdown’ tab at the top of the page.
At the top of the screen, you’ll see options for ‘company’ and ‘plan section’, allowing you to look across everything or to delve into particular details.
Hit ‘generate report’ to see how the figures breakdown into turnover, profit, and costs.
Viewing multiple plans in a single report
You can choose as many current, upcoming, and past plans as you’d like to see from the ‘plan’ dropdown.
Click the cross by a plan’s name to remove it from the report.
By default, the report will be broken down by the top level of each plan, showing each plan in separate sections.
You can compare plans more closely by choosing a custom breakdown.
Custom report breakdowns
You can split the report by different sections and values by choosing a custom breakdown.
Click the ‘add a custom breakdown’ box next to the plan dropdown field to see the breakdown options. You can choose a different plan section level or an activity category.
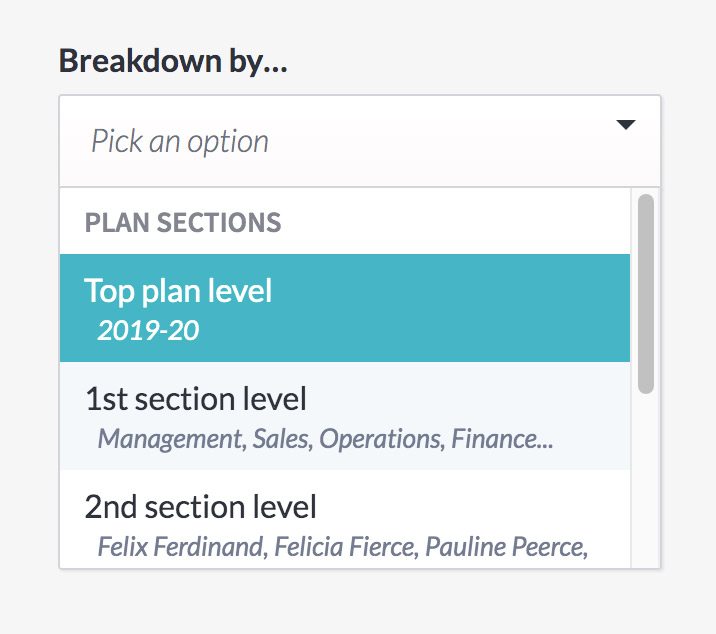
Breaking reports down by plan section level
Plan section levels are all the plan subsections at that level of their plan.
For example, here, the 2019-2020 plan is broken into five subsections. These are at the first level.
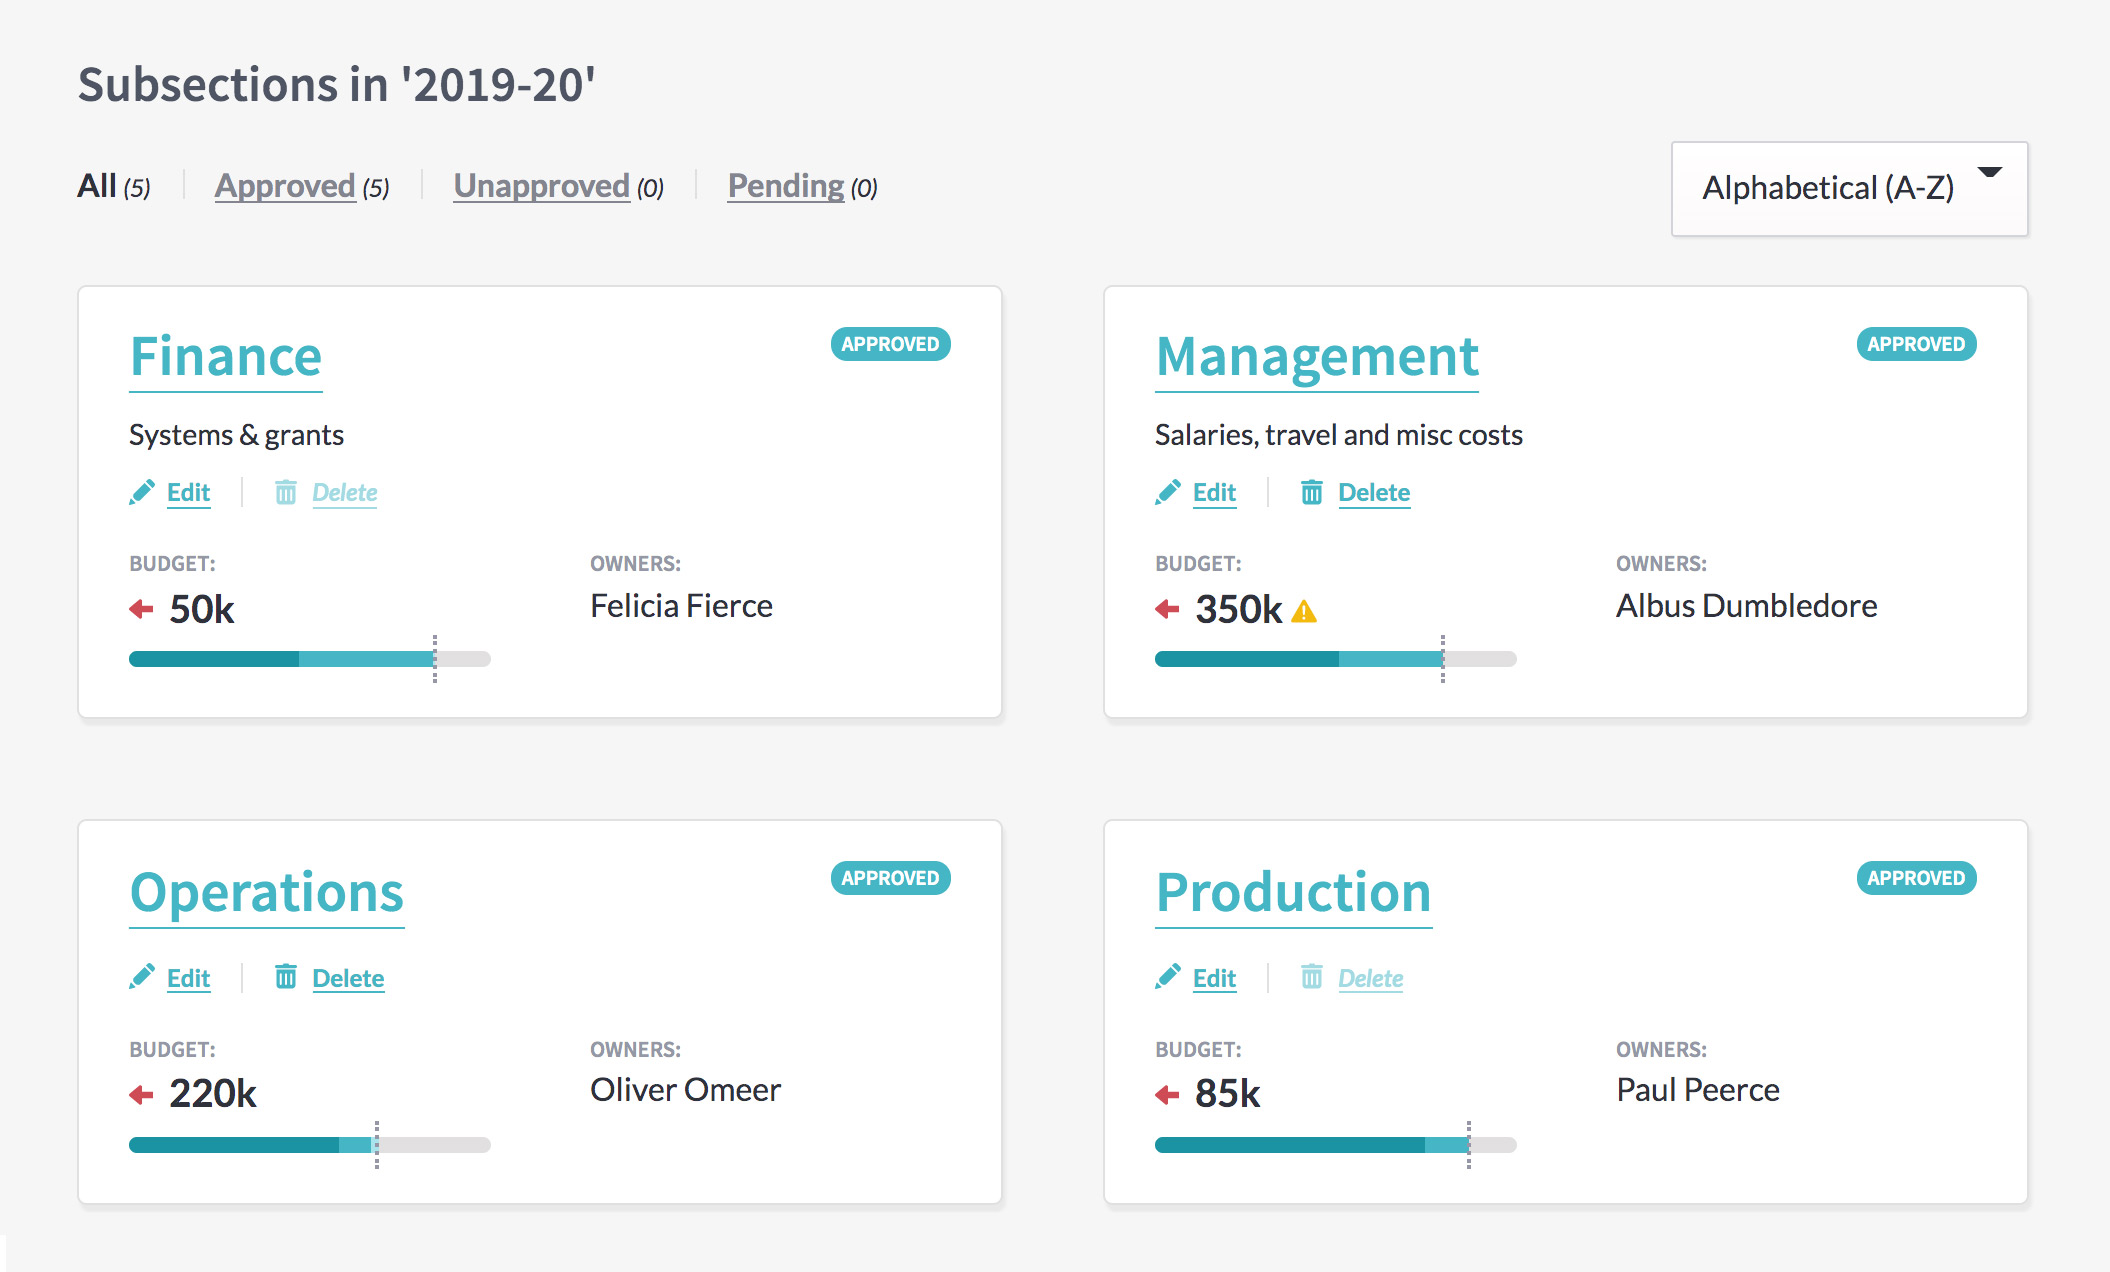
Each of those subsections either have their own subsections – the second level – or have activities.
If you wanted to see a report on two different plans, starting from their second level, the report would begin with the subsections of the subsections directly inside the parent plan.
You’d still be able to see this detail starting from higher up, though you’d need to drill into each subsection.
Looking across multiple plans, any plan subsections which share a name on the same level will be merged together, so you can track plans across different financial years or merge plans budgeted in different currencies.
Breaking reports down by activity category
Activity categories are a way to structure and organise activities across your company in whichever way makes the most sense to you.
For example, a multinational business might want a ‘location’ category, with options for ‘Asia’, ‘North America’, and ‘Europe’. Users would be asked to choose which location their activity belongs to when they make one.
With activities structured and organised this way, we can easily breakdown reports by location. (Or by initiative, department, function, client, favourite colour…)
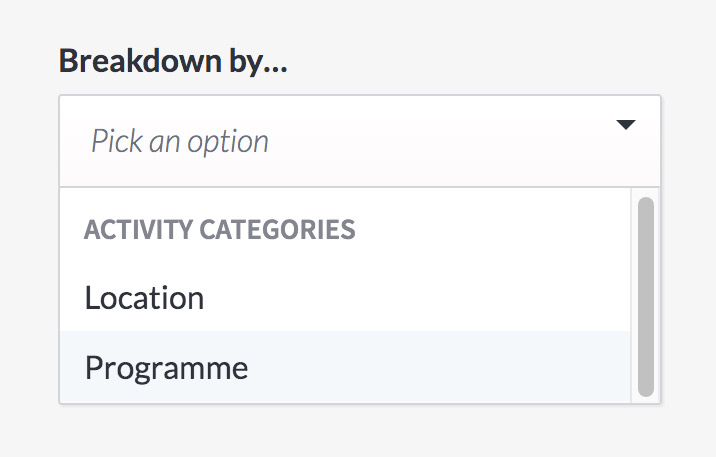
Once your activity categories have been set up by power users on the ‘settings’ page, you’ll see an ‘activity categories’ section at the bottom of the breakdown dropdown field.
Select a category to see the report broken down by that category’s options.
Creating a detailed breakdown
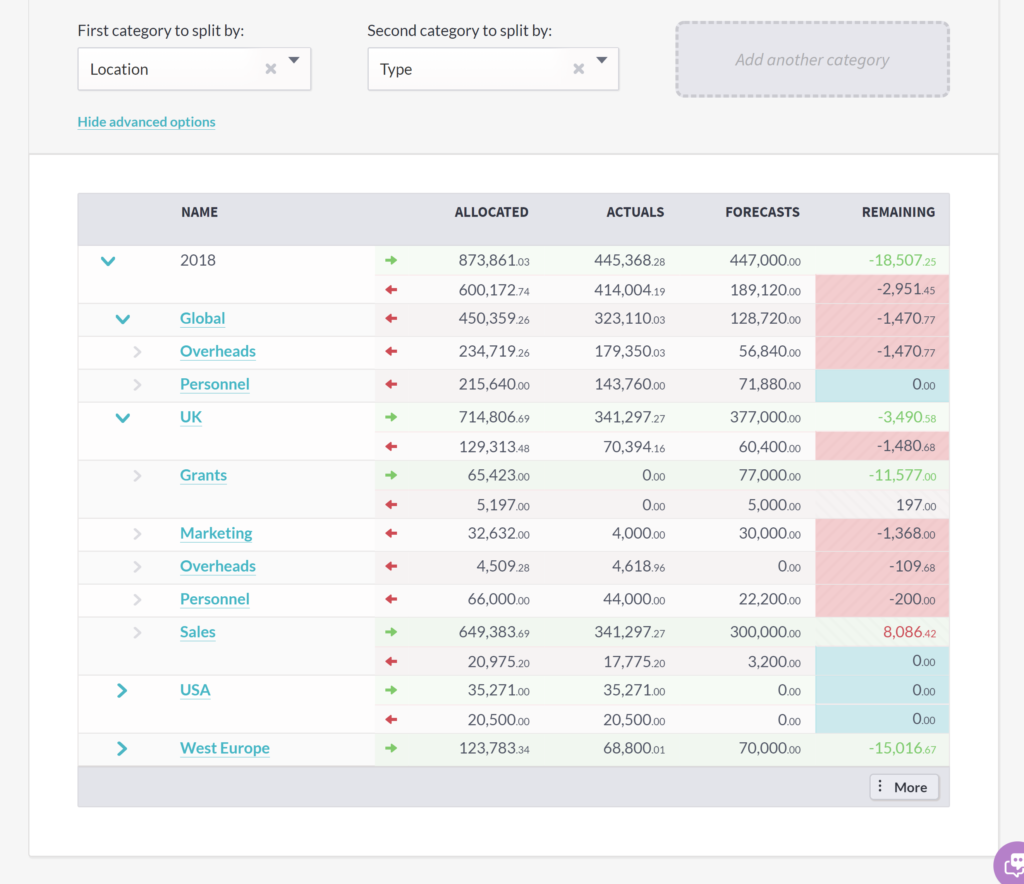
You can go as in-depth as you’d like to, selecting multiple section levels and multiple activity categories by pressing the ‘add another breakdown’ button.
And you can tweak and re-run the report as you need, to get a full picture of what’s happening. Breakdown the financial year by department first and location second – then run a new report, breaking down by location first, department second, to get a full, 360 picture of exactly what’s happening across your organisation.
Compare plans in different currencies
But seeing multiple plans on the same report goes deeper than keeping everything on one screen – if you have plans in different currencies, for a multinational business, you can convert them into the same currency to easily compare how different parts of the business are running.
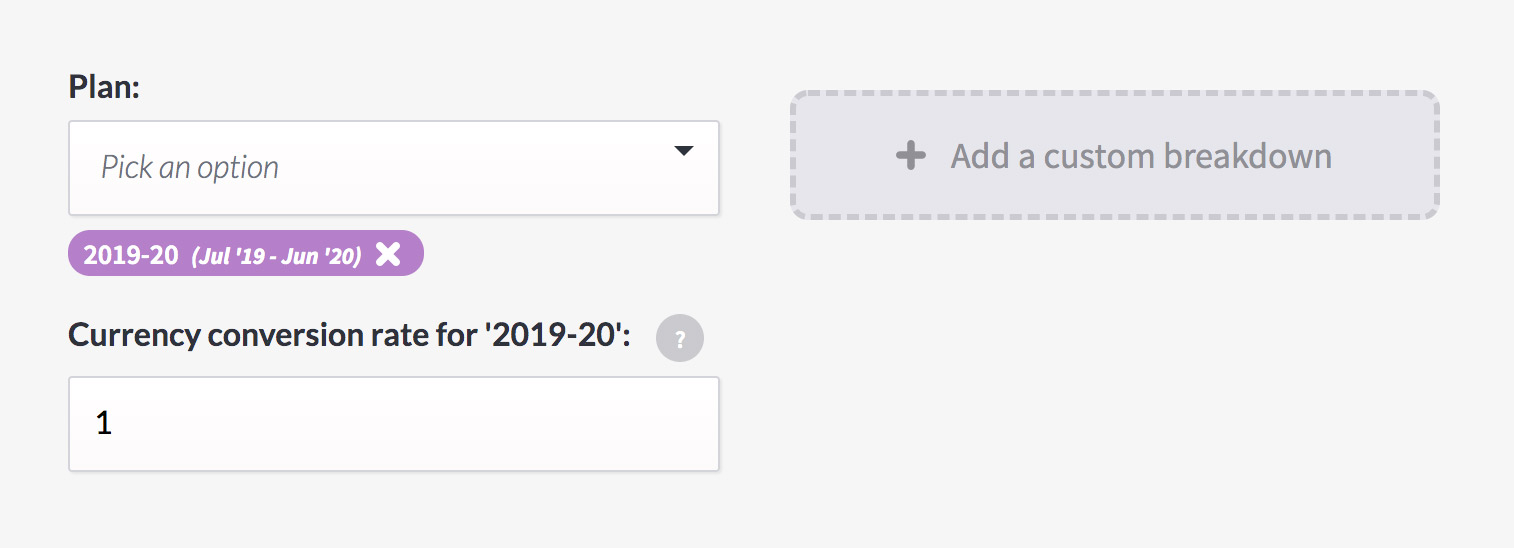
Click ‘advanced options’ at the bottom of the report form to see a currency conversion rate for every plan you’ve chosen. You can manually set this to whatever you need, for complete control over how the numbers in the plan will be presented.
Setting the rate to ‘1’ won’t change anything. ‘2’ will double the amount. ‘0.75’ will reduce the figures by 25%.
This is also handy for running reports for your plans in a different currency. If you need to show American investors how their dollars are working, changing the rate to the conversion amount, like 1.24, will convert a GBP plan into USD.
See what’s really happening in your business
Run a breakdown report now to see what’s really happening in your business.
And, if you have any ideas or suggestions for other management tools you’d like to see, let us know! We’re here to make budgeting easier for you. (Yes, you specifically.)
The post Feature spotlight: breakdown reports appeared first on Beyond.
]]>The post Activity Categories: new dimensions of budgeting appeared first on Beyond.
]]>Being able to answer these questions in real-time already places you many steps ahead of most businesses, but we can do even better.

How about being able to answer these questions?
- What’s my monthly spend on travel and how does it compare to other categories?
- How do my revenue and costs compare across locations?
- How much per year is going towards business-as-usual versus strategic work?
- What is the budget variance for my key programmes across the business?
These questions, and many more, can now be answered with the powerful new view added to the Budget Explorer:
And this view is just the start – from here you can click into any category and drill down to the underlying activities, actuals and forecasts that drive it. Very cool.
These views are made possible by the use of ‘Activity Categories’. They’re extremely flexible – think of any category or dimension you’d like to tag activities with (like Location, Programme, Type, Client, Goal…) and list the different values this category can take. Then whenever any user creates an activity, they’ll be able to choose which category value to tag that activity with.

In only a few clicks, you can ensure every relevant activity is tagged by the categories that make sense to you. Tracking budgets and managing activities across the business just got a whole lot easier.
Happy tagging!
Of course, the Budget Explorer view and the underlying Activity Categories are both completely customisable, so you can slice, dice, breakdown and summarise based on your precise business needs (and update them as they change).
With Beyond, you’re always in control.
The post Activity Categories: new dimensions of budgeting appeared first on Beyond.
]]>The post CFO Secrets: Effective budgeting for SMEs appeared first on Beyond.
]]>So, how can a business budget effectively? A budget is most effective when all its budget holders work collaboratively alongside the finance function. The more involved budget holders are in creating their budgets, the higher the likelihood they will be engaged in the whole process and indeed be inclined to work harder to ensure budgets are met and exceeded.
Getting started

Although budgets are a forecast of expected income and expenditure, we can use historic performance as a baseline to check assumptions we are making when producing our budgets. It can be difficult to predict future revenue especially for businesses working on a project by project basis. Gross profit margins can vary between projects. Overspending is often inevitable when staff need to meet a brief and just get things done.
Past data can be a great starting point for your new budget. Due to the increase of artificial intelligence and automation within finance, budgeting is more insightful and accurate than ever before. However, there is always an element of uncertainty to consider, especially for new businesses who haven’t yet accumulated any past data for insights on expected performance, or those entering a new market. Even the slightest change within a small business can impact the financial future of the company. For example, government legislation changing minimum wages or pension contributions which are out of your control need careful consideration and planning.
Understanding the risks

It’s crucial to understand your current situation and, so, be able to pre-empt any risks in your business model. There are always unexpected costs that arise throughout the course of operations and having a contingency within your budget can help absorb these risks. Preparing your budget with these unexpected costs in mind, (such as equipment needing to be repaired or replaced) will keep your planned expenditure as realistic as possible. Once a stable yet realistic budget has been agreed, the regular monitoring of progress against this becomes critical for the full process to be effective.
Keeping on track

Producing budget vs actual reporting can highlight variances at an early stage to give a company opportunity to address what has caused any overspend or difficulties meeting the revenue forecasts. This constant check against budget proves to be a valuable piece of management information to monitor financial health and performance for company owners, shareholders, budget holders, the finance team and wider business.
Change is the only constant

Budgets are never static, they evolve and change over time. By re-visiting your budget at regular intervals and adjusting it accordingly, the more accurate your budget becomes. This will enhance the power it gives the business to make those important financial decisions. So, what are you waiting for?
The post CFO Secrets: Effective budgeting for SMEs appeared first on Beyond.
]]>